Gnuplot in Raspberry Pi
Raspberry Pi has been used for interfacing different types of sensors. Signals from these sensors are stored in a file, generally this file is called data file. Graphical representation of these data offer better visualisation. Here I am going to explain How these data file can be converted into graph using a tool called gnuplot. Install gnuplot in your raspberry pi using apt-get.
first of all create a data file with name data.dat
sudo nano data,dat
and make two column with some data in it
save it with ctrl X then Y
open gnuplot from terminal by entering gnuplot in terminal. gnuplot will open with its prompt
This is a gnuplot command prompt. From here we will plot the data from data.dat file.
In gnuplot command line enter
plot 'data.dat' with lines and we get our data plotted as following
Set title to this plot by entering
set title 'graph'
plot 'data.dat' with lines
Lets add some more things to graph. Enter the command as I had shown in figure below
In this way we can do many things with this plot. In above figure 1:2 represents first column as X axis and second column as Y axis.
Lets add one more column to our data file.
sudo nano data.dat
We can plot multiple graph in a single gnuplot window, Since we are plotting 2D graphs, plotting would require two columns. Have a look at figure below and it is self explanatory
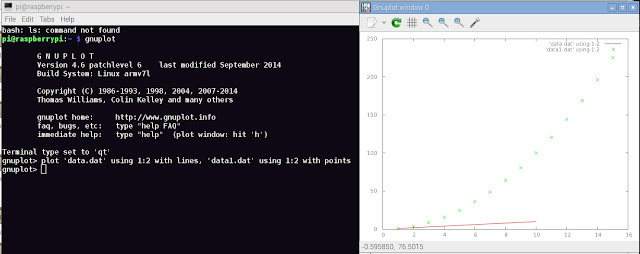
But how to plot a graph from two different data file. To understand this, create another data file with name data1.dat
sudo nano data1.dat
open gnuplot and follow the figure below, it is just simple as that
Fine, now we know how to plot from two different data files
But always opening gnuplot from terminal is not always desirable. It mean we can invoke gnuplot from our program and can pass gnuplot commands to it. Here is a simple script in C
sudo nano gp.c
gcc gp.c
sudo ./a.out
you will get your plot open .To add more functionality just pass more gnuplot command through fprintf.
gnuplot is open source and fully documented. Go to the official page to explore more options.


No comments:
Post a Comment